Driver Project 11 - Routine Assessment of Infections, Prevention, and Control of SARS-CoV-2 on Unequal Populations
To reduce the impact of a pandemic on an unequal population such as that in Brazil by applying mathematical and statistical methods to socio-economic and health data to predict COVID-19 transmission and health outcomes.
Juliane Foseca de Oliveira and colleagues at Fiocruz in Brazil have developed mathematical and statistical methods to model COVID-19 transmission across populations in Brazil to better inform local intervention efforts. Social and economic inequalities are known to shape the spread of diseases. They have integrated existing health data together with social and economic determinants for 5,570 Brazilian cities, as well as data on the effects of the mitigation strategies and social mobility patterns. These data have been used to develop and apply statistical analyses and nonlinear mathematical modelling to forecast disease outcomes that consider the specific socio-economic conditions, which influence transmission rates. The results are presented on a user-friendly surveillance platform that can be used by local governments and communities to identify the most effective control methods for their region.
Driver Project 11
| Title | Journal | Date |
Type | Abstract |
|---|---|---|---|---|
| BMJ Global Health | Dec 2022 | Publication | To classify the most up-to-date factors associated with COVID-19 disease outcomes in Brazil… | |
| Aridhia | May 2022 | Article | One of several driver projects from Brazil-based Oswaldo Cruz Foundation (Fiocruz), this one is led by a team of four: lead PI Juliane Oliveira, a mathematician and researcher at Fiocruz and at the Universidade do Porto (Portugal)… | |
| arXiv | May 2022 | Pre-print | Data documentation, metadata, data and all coding is freely available and described in the following manuscript: da Silva, Nívea B., et al. |
| Title | Type | Description |
| GitHub codebase | Code | All coding has been documented and is freely available in R or Python languages on the project’s Github page |
| Risk and vulnerabilities variables related to COVID-19 in Brazil – PAMEpi data | Metadata | The current file contains community-level aggregate information extracted from health, human mobility, population inequality, and non-pharmaceutical interventions. The integration of variables from different sources facilitates the data analysis and epidemiological studies once the data set is aligned and represents a single entry for each city and day since the beginning of the pandemic in Brazil. The data includes, for example, the daily time series of mild to moderate cases resulting from the Flu Syndrome database, hospital occupancy and deaths from the Severe Acute Respiratory Syndrome database, vaccine doses administered daily, etc. |
| Title |
Description |
|
| Project website |
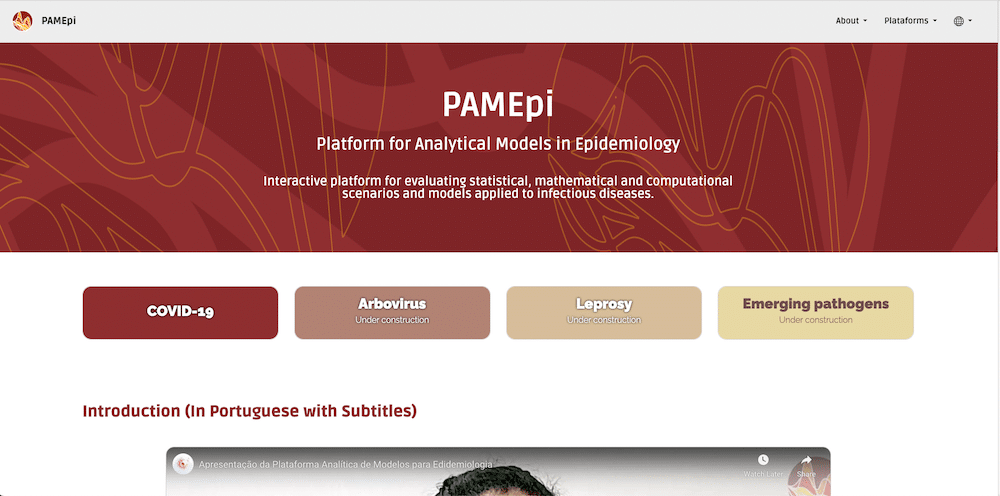
Website for project PAMEpi (Platform for Analytical Models in Epidemiology). PAMEpi is an interactive platform for evaluating statistical, mathematical and computational scenarios and models applied to infectious diseases. |

|
| Visualisation dashboard |
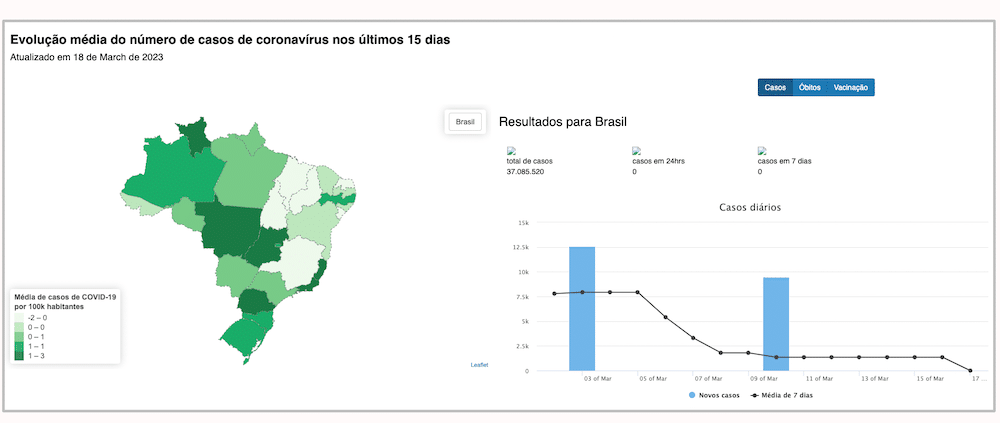
This platform aims to provide a user-friendly interface, enabling researchers and policymakers to assess the impact of the spread of (emerging) infectious diseases in their respective areas of interest. |

|
| Covid-19 data processing – Youtube playlist tutorials |
In their project, ‘Routine Assessment of Infections, Prevention, and Control of SARS-CoV-2 on Unequal Populations in Brazil’, Juliane Fonseca de Oliveira and colleagues at Fiocruz in Brazil developed mathematical and statistical methods to model COVID-19 transmission across populations in Brazil to better inform local intervention efforts. Juliane Oliveira and her team also created videos and a YouTube playlist with video lectures intended to serve as advanced tutorials based on the research activities developed at PAMEpi. |

|
Video Transcription
The idea of the project is for for the impact of interventions vaccination strategies, in the transmission of COVID and try to consider the different levels of socio economic conditions in Brazil. So that’s our objective in order to understand that, kind of complex, although it’s simple the idea so understand that the poverty that the overthink points on the spread of the disease, but when we put in the table what we need, so we need lots of information.
So we have data about the clinical conditions of patients or our data that’s not finding five. So we know the number of case if this case the we know the age group or the some comorbidities like clinical epidemiological features of the patient. So we have this type of data. We have also data about mobility, inter cities to understand a little bit more about human behaviour about like mobility in the city. So what we use Google mobility, we have parameters to estimate the the level of economical conditions and location economical conditions in the municipality to in order to associate our study with overview we use this new data set. We have also data about the strategy of vaccination, so we know levels of people who are vaccinated, age proof type of vaccine, on those already getting booster and so on. And so to complete we have also data about the governmental measures that have been applied in each state. So we can follow up with the pattern of restrictions and associate this with human behaviour and then go to the other person.
So these are the three main three or four main types of data that we have health, human behavioural, poverty, and the vaccination and the knock on effect. The biggest challenge is, first of all the database of data in real time, because we know this different set of data they update in different moments. So they the best scenario would be that we can follow these altogether.
Another problem that appeared that we were not, we didn’t foresee before was that, depending on the states depending on the region, especially if it’s a poor rich patient, the update of the data is different for some regions more effective.
So following we’ll find the pandemic is complicated, especially in the population we are more interested which is the vulnerable people. And the second issue is about scientific divulgation. So we want to do a project that influence on get fast answer, right, we wanted to finish. That’s the end and we have one year of project and the objectives that we produce some results. That can immediate try to reduce the pool situation and the critical situation. And we noticed that scientists delegation is very crucial and we kind of rebalance our work in order to produce material for the scientists. And when relaxing the measures for them is like the pandemic finished and it’s not and then the problems come again and then it’s way more difficult for we adapt to the modelling of things. We saw that scientific delegation is really a challenge and the real time update of data as well.
So I would say that mainly the impacts improve the quality of life of the people especially because to we want to finish this work and to guarantee that the measures that we have to improve the quality of life and avoid mortality . So we want people to be vaccinated. . So that’s the main thing that working for me we have experienced last year for doing that and somehow it was successful.
And with this grant, it’s we are making more growth than we have this opportunity. At least if we do a little bit and we can change one percentage will be really a lot. So that’s the the main path that we want and guarantee that the vaccination strategy and which can be also cover more vulnerable population and provide to the community like all the results with validation that the material that we are producing.
So we already have a result. I mean, we are planning that by the end of November, we already have the main core vaccination strategy that we had to separate into parts because it was getting very long. So you know that the EU countries like in need low actually, in all countries will. The main thing is to reduce hospitalisation and reduce mortality. So we already have a type of model, which we understand the dynamic of the disease and how its influence on these hospitalisation and mortality. So we now created a model with we can plug the vaccinations partition. So we now we by the end of November, we wanted to finish first paper which describe the parameters because we have data of the clinical conditions. So we can estimate the value of hospitalisation previous and afterwards, we can estimate the mortality risk estimate many parameters for the real specific conditions of certain regions, and using model so this is going to be very, very good.
We already have the model and we hope that we can already implement the first model we want to set for each state by the moment also to not be too much. Long the results and then nothing they’ve this organisation thought of who implement everything and then the person can go even for the city and fight for understand the situation. This is the main things and the map of the map of risk. Actually, it is world like statistical invasion modelling. So what we are planning the first sketch is to have what we call the roll.
Analysis is the level of description so you can make a descriptive analysis of the risk of the disease in each municipality and then later that we are going to implement a more the Bayesian model. But that’s it. So parameter estimation, we also have the documentation like they are briefing for the whole dataset which also contains some descriptive analysis and highlights the importance of the data set the potential, what else we can do that can go beyond the project. And this thing about vaccine that’s the main result that we are retaining now the month of November.
Let’s suppose let’s suppose at least that the data sets they are available . So, there are several limitations on data which appears because of problems of modification. For instance, we have now the data set of new and new the moderate case of COVID. And also distribute gave up about 52% of the of the severe case of COVID did not have a final classification. So for sure, it’s case of COVID, because we know there is under notification significant. We cannot wait so much to have this data set like clean and proper for us. So one type priority would be algorithms that can improve the data. So the quality of the data. So classification algorithms to better approximate the number of days to the reality of the of the disease not to work, for instance then that measures that they will go back to the normal set conditions also they are text, we need to create codes to understand the text and categorise. And so all these tools that can be used to improve data in this stage that we are, I think would be one priority. Because right we have already a lot of data set, let’s say and projects like I call that they’re collecting all this data set. So one priority would be improving the informing the quality of the information. And the second would be the science of utilisation. So it is one thing that we were not using before and which still I would say even by myself I’m a mathematician I was most of the things I was doing. It was really for the scientific community and sometimes even just for mathematicians, statisticians like say, but I think is crucial now that we learn how to pass information how to, to be more, have more the feeling the human feeling of how to manage the needed information, how the population needs to understand not so we can make it epic like have models have results that will really be effective and wipe a flight so I think this tool, the tool like mini and they are important the championing priorities I would say, I wouldn’t be doing work without them. I will be doing simulation which, it can give insights. But it doesn’t apply for reality to don’t apply to the data. So it could be just, you know, abstract ideas. I think all the work would be nothing. I do visualisation other scientific irrigation, I do modelling so without data, this would be nothing for the company. So it’s the first thing that is proper to which to show data sharing.
Now I kind of got some more collaboration still recently right? With the people from India, some professors from India. And we see that we saw this opportunity I’m having now with this project. For me it was really a dream that we can have a team of people working in different things like we are very disciplined and produce something. And when I was talking with this group of people in India, they I felt that today so I cannot wait to have a kid who have the kid and she has a candy in the hand and then the other kid does not have he wanted to be I wanted this to I don’t know to join him say like you know you can do the same for India. Let’s find out that they are let’s try to do the same. Because we know we have similar problems we have similar issues and so what I feel that may be would be something nice in that opportunity to have more not only national but international like point like more have more global idea. And yeah, I hope that new people out somehow way to cover this. This other grouping some Asian countries, right. African countries you already doing that, but we know that the limitations of the resources not so much


